Methods
After the collections of particulate matter on filters by samplers in the monitoring stations, data processing was performed as shown in the flowchart on the right. Firstly, the Teflon and quartz filters were analyzed by different methods as shown in the slideshow below to quantify:
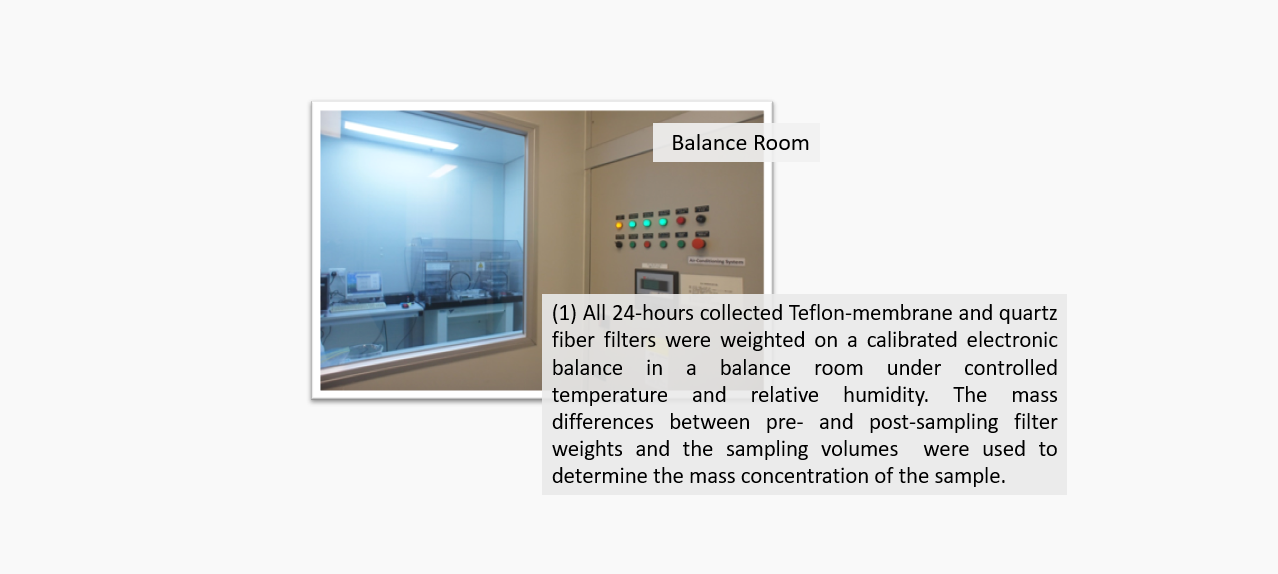
- PM2.5 masses,
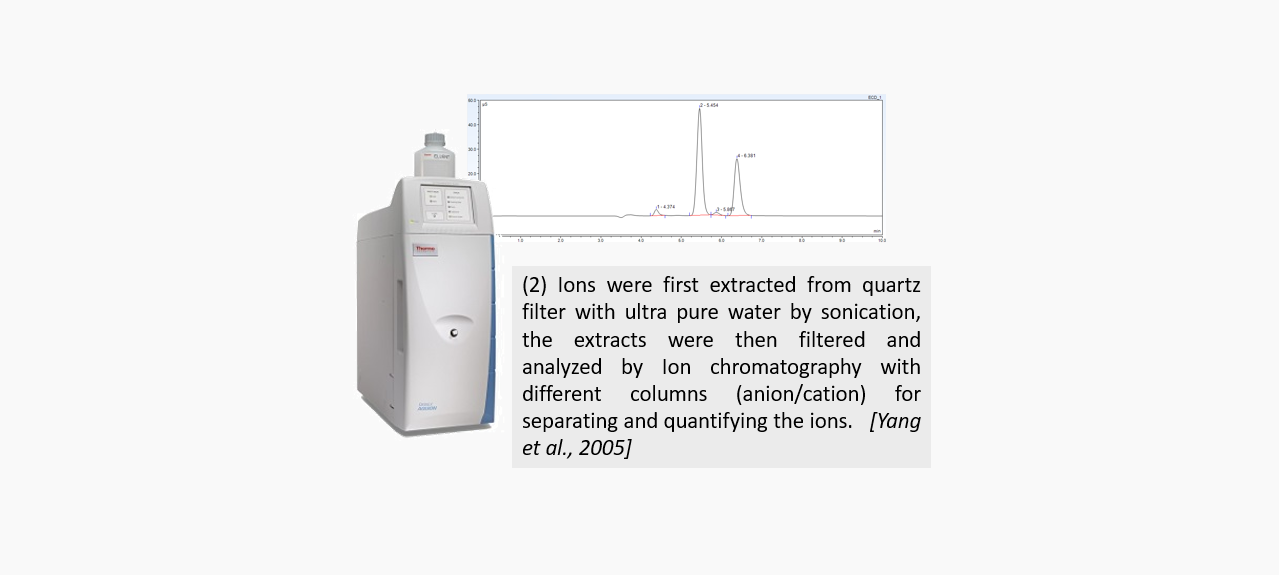
- major ions including Na+, K+, NH4+, Cl-,
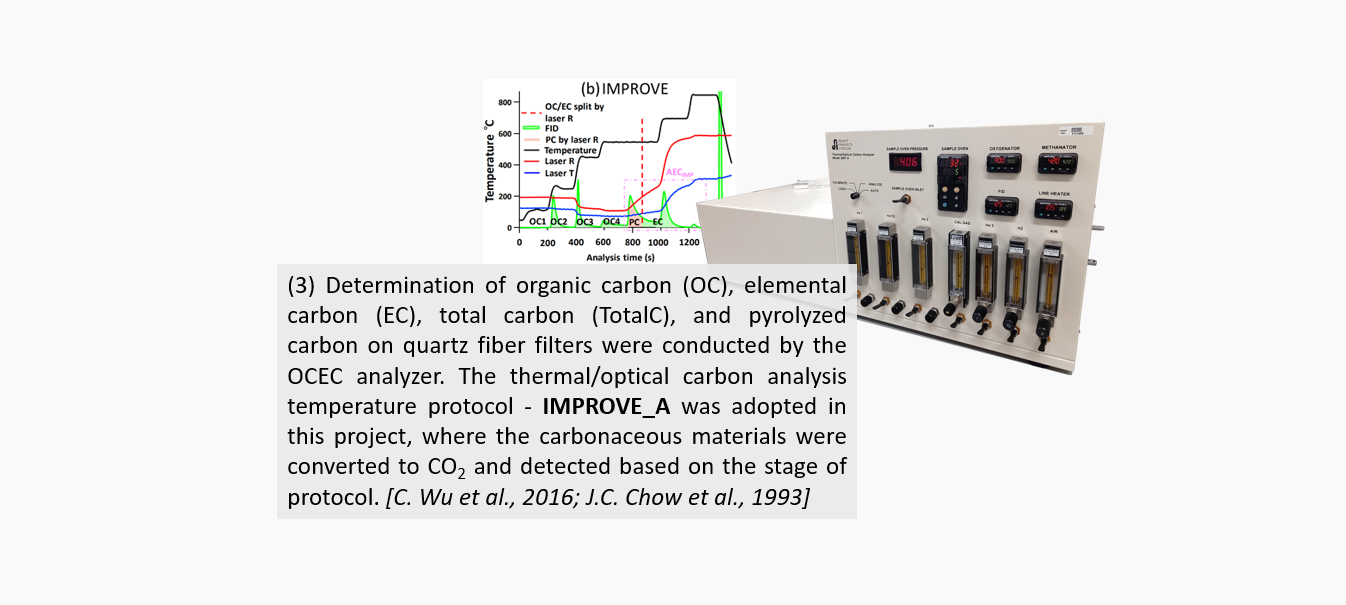
SO42-, and NO3-, - organic carbon (OC) and elemnetal carbon (EC),
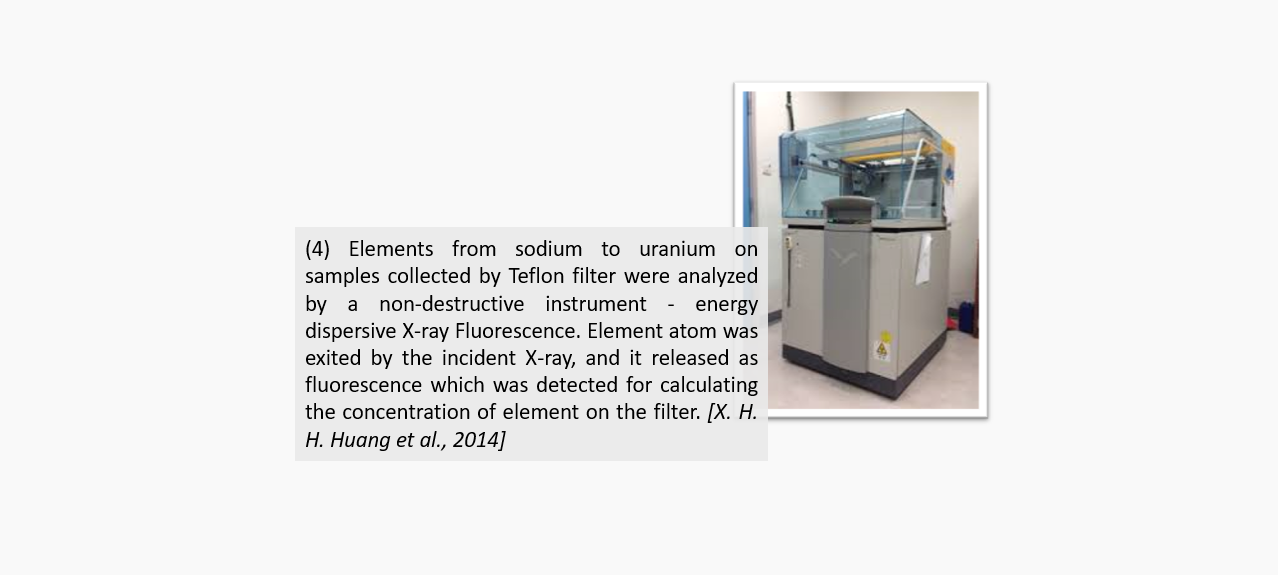
- elements from Na to U,
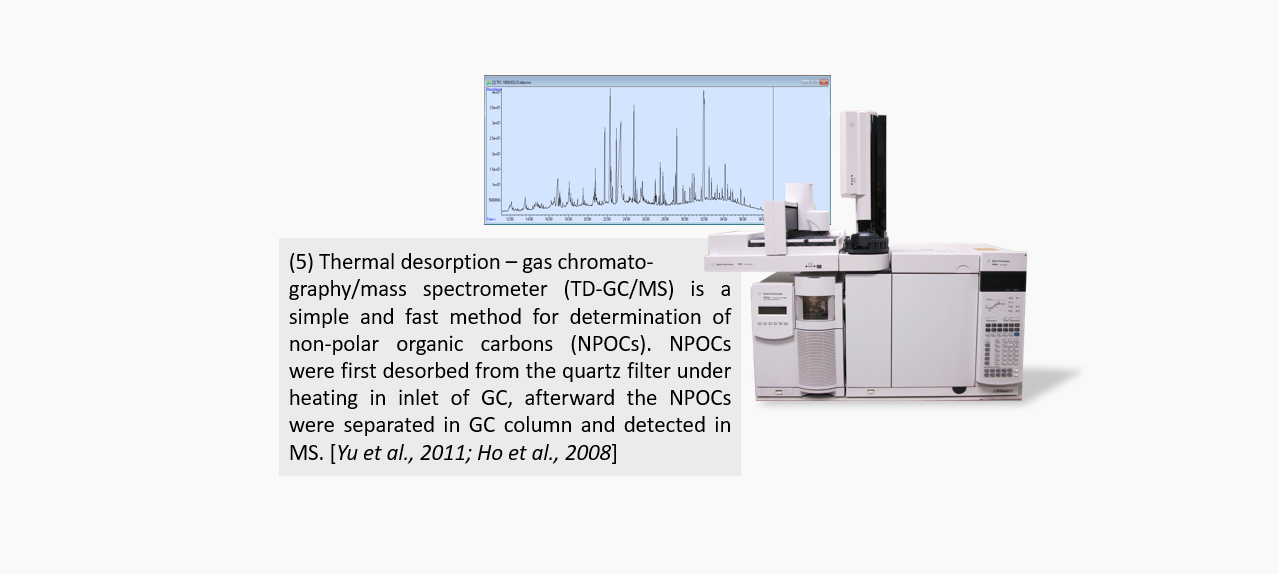
- non-polar organic carbons (NPOC), and
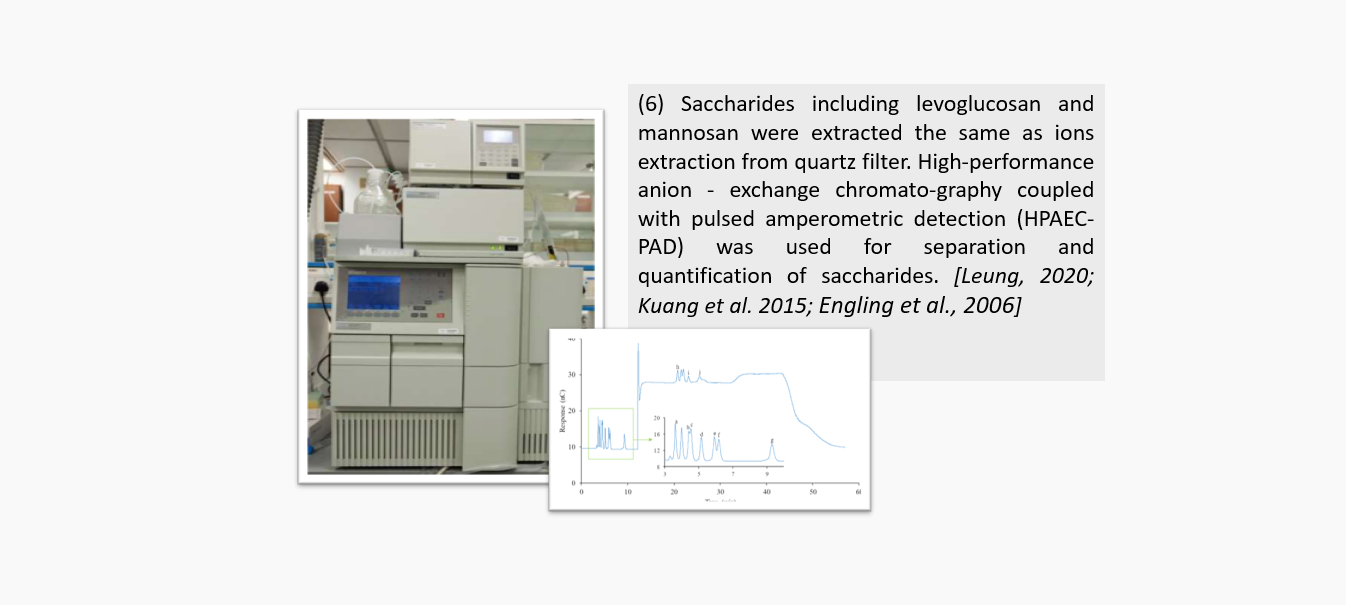
- saccharides including levoglucosan and mannosan.
The results were then validated in different levels. And lastly, comprehensive studies such as Trend analysis and source apportionment of PM2.5 were conducted with those valid data.
- Sampling
- Data acquisition
- Data validation
- Level I
- Level II
Internal Consistency tests - Level III
Data Interpretation process
- FLAG measurement significant
deviated from procedures - Reconstructed vs Measured
PM2.5 masses - PM2.5 mass from online continuous
measurement vs offline 24-hr collected samples
- REMOVE invalid values/samplings
- Cross-method checking of same species
(e.g. SO42- from IC vs S from XRF)
- ESTIMATE precisions from Replicate and Blank analyses
- Collocated samplers measurements checking
- Outliers identification from time series over sites
- Prepare a data qualification statement